こんな課題を抱えていませんか?
課題1
システム仕様の変更が
繰り返し行われる

課題2
社内の引継ぎでコピペコードが
管理できていない
課題3
リファクタリングを行う作業も
工数も足りない

\ソフトウェア開発現場の課題を解決/
CloneTrackerでできること
01
要注意コードを⾃動でお知らせ
解析は⾃動実⾏、4つのアイコンで通知
 コピペを検知しました
 コピペが変更されました
 片側だけに変更が入りました
 もう片側に合わせるような変更が入りました
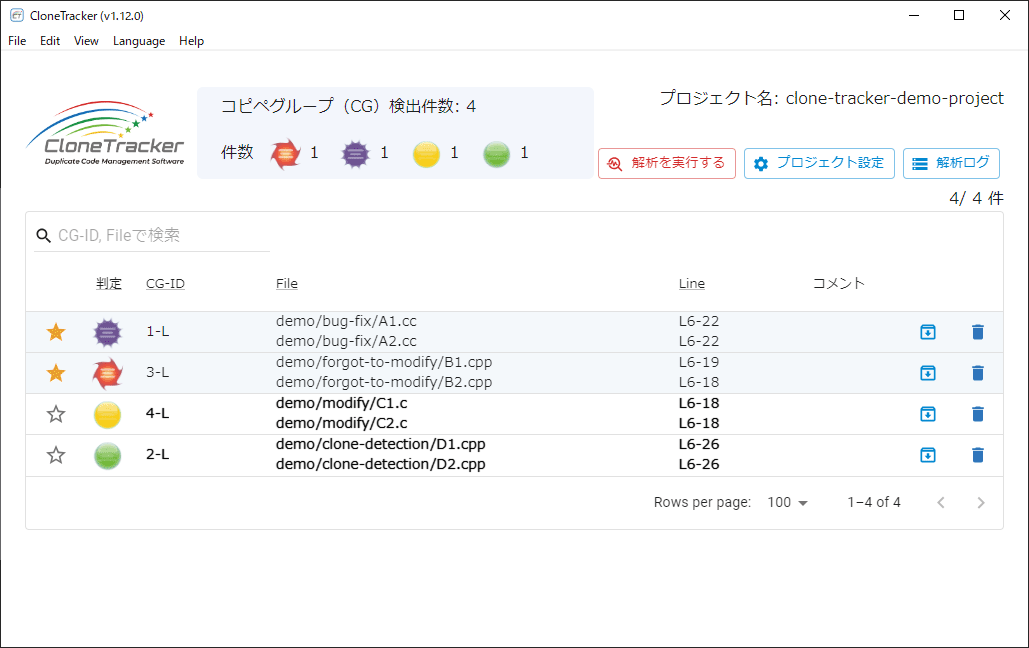
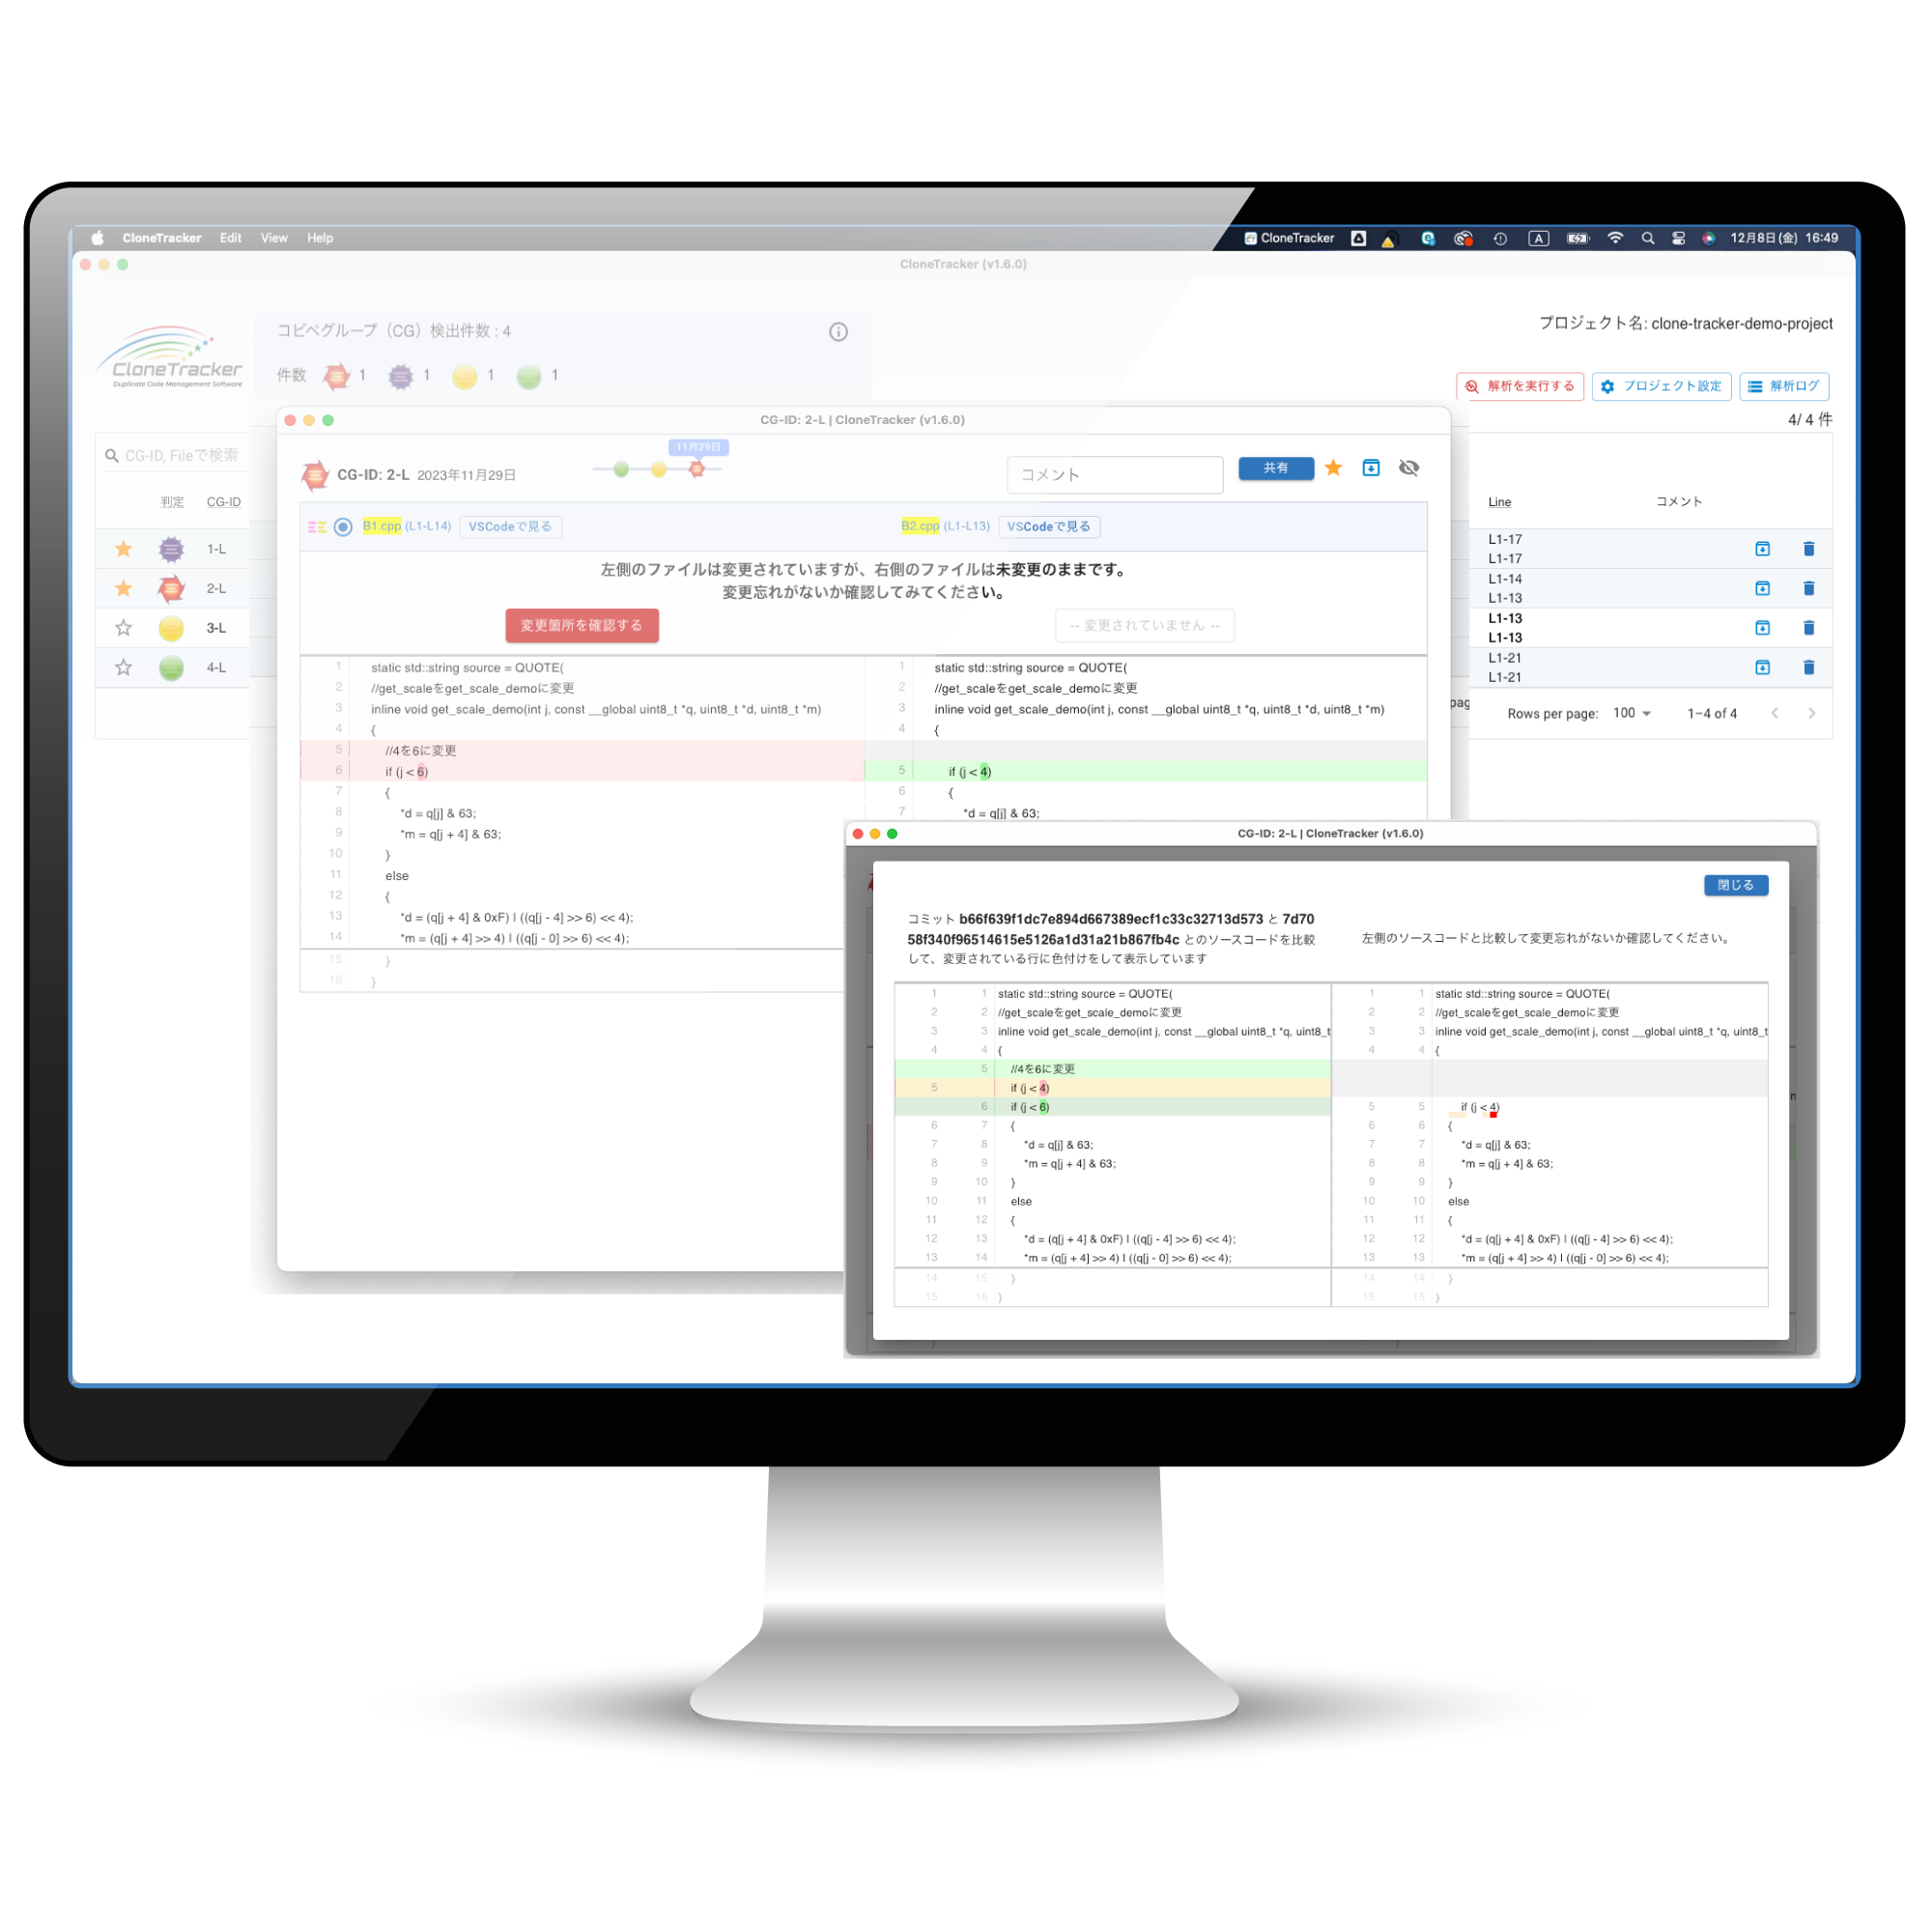
解析結果の一覧(イメージ)
02
バグの温床となる変更忘れのコピペコードを検出
バグの温床をプッシュでお知らせ
CloneTracker専⽤のDiff Viewerを搭載。変更忘れ箇所をユーザーにお知らせします。
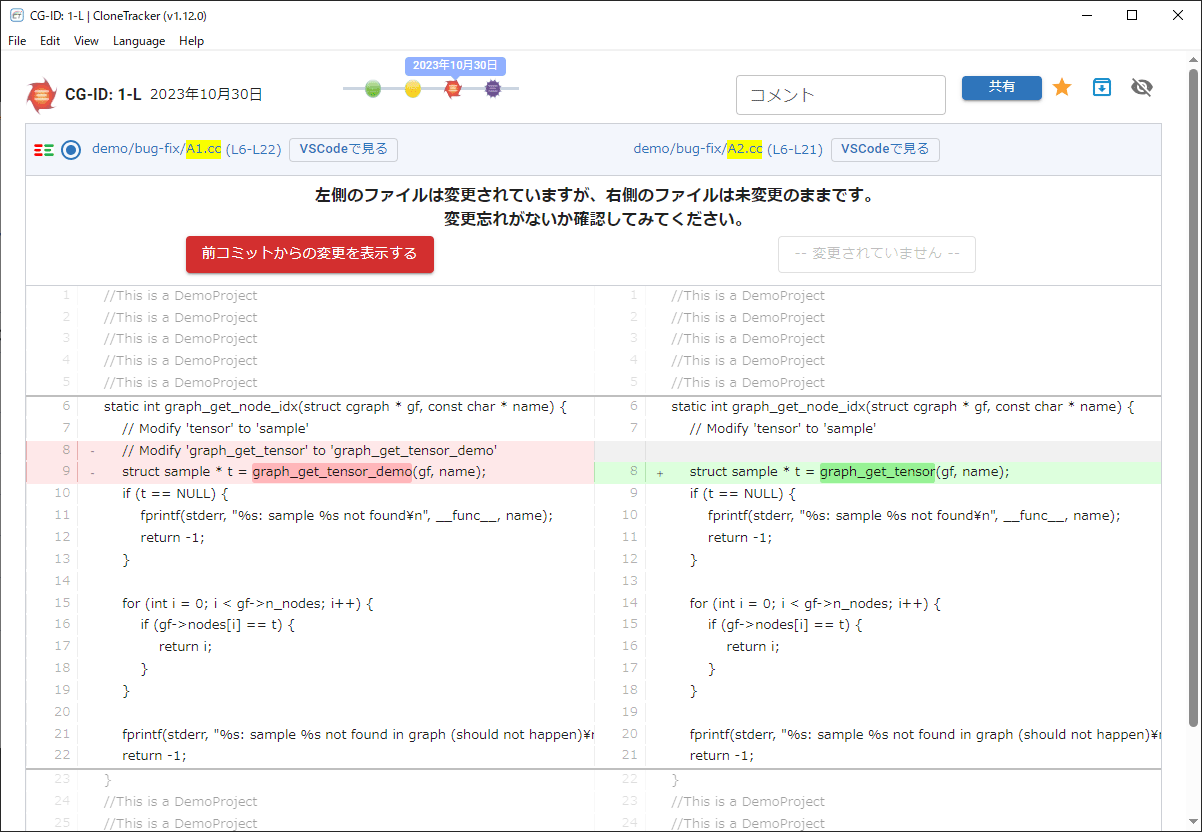
コードの違いを表示するDiff Viewer(イメージ)
03
リファクタリングの手間を軽減
過去の不具合原因のコピペコードも独⾃アルゴリズムで検出
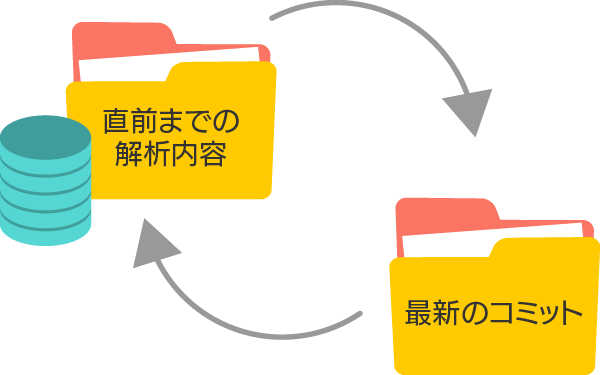
コード管理したいディレクトリ登録後、過去バージョンに遡って解析を開始。初回解析以降は⾃動で解析を実⾏します。初回解析以降は10分おきに直前までの解析内容と最新のコミットとの差分を解析します。
ご利用環境
対応言語
C, C++, C#, Java, Python
β 版 : JavaScript/Typescript, PHP, VB.net, Rust
動作OS
Windows 10/11
Mac
Linux(Ubuntu 20.04)
プラン
ビジネス
プロジェクトメンバー数に関わらず
1プロジェクトあたり
1プロジェクトあたり
11,000
円 (税込)/月ご契約は
66,000円/6か月
132,000円/年
アカデミック
学生、大学教員が学業または研究目的で使用する場合はアカデミックプランをご利用いただけます。 アカデミックプランは無料です。 ご希望の方は営業までお問い合わせください。
まずは無料でお試し
Step2
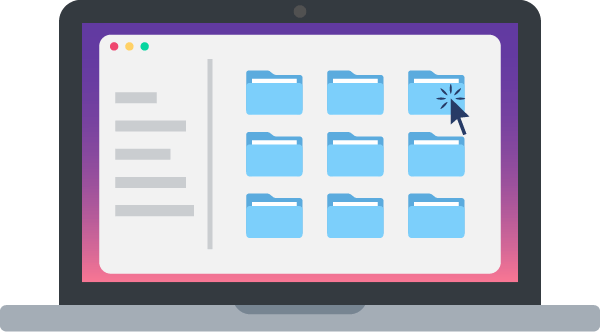
対象ディレクトリ登録
対象ディレクトリ登録
Step3
自動で解析
自動で解析

関連リソース
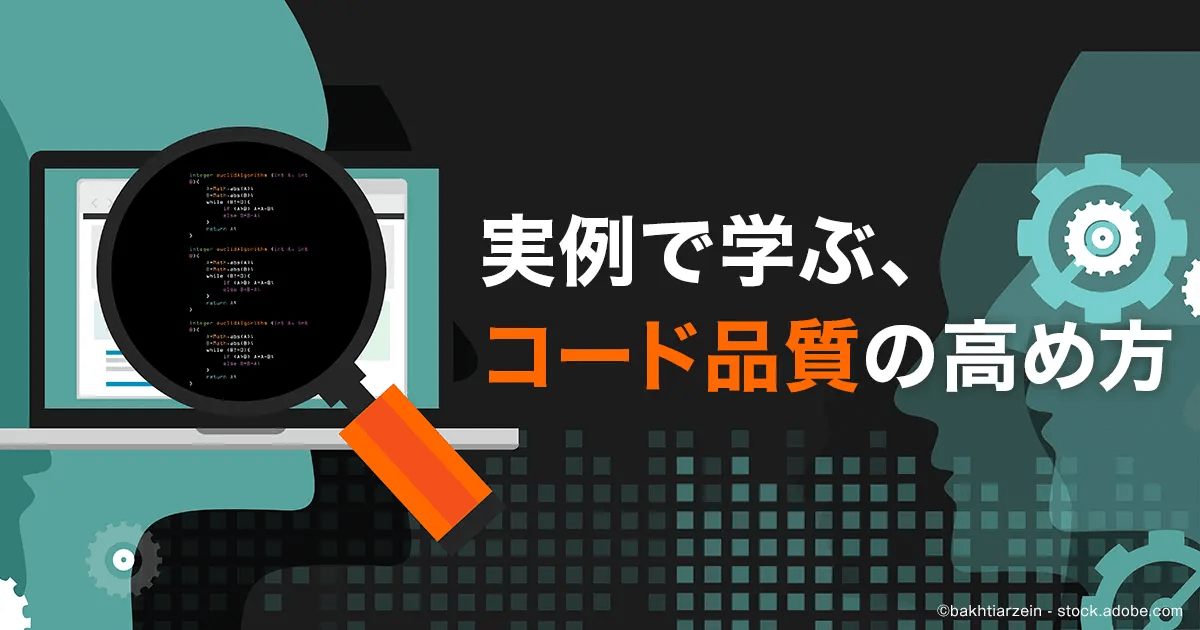
CodeZine連載 - 実例で学ぶ、コード品質の高め方
新人ソフトウェアエンジニアや、コーディングを基礎から学び高めたい方を対象に、ソフトウェア品質の重要性を説明し、具体的なアクションについてハンズオンで解説しています。